El sistema financiero a finales de la Edad Media: instrumentos y métodos


- -
- 100%
- +
Although annuities were important in redistributing of savings, there were other techniques available in the late Middle Ages as well: money was moved around via networks of moneylenders, itinerant merchants used financial techniques such as the bill of exchange, and there emerged early banking institution –such as the Monte dei Paschi di Siena, founded in 1472–. This was also a time of expansion of financial markets: instead of having money lay idle, savers began to invest, causing money to be reallocated in a more efficient way.13 However, the redistribution of savings was not self-evident, as it could be severely hindered by usury laws, prohibiting the taking of interest, and thus interfering in processes of price making. Initially usury legislation seems to have been quite harsh in the Low Countries.14 However the introduction of annuities probably gave an impulse to the redistribution of savings because the Church did not regard these as usurious: pope Innocent IV already sanctioned annuities in 1252.15 Since these instruments obviously allowed for the circumventing of usury laws, some theologians continued to question whether annuities should be allowed. Until the fifteenth century several popes spoke out on the subject; all sanctioned annuities.16
Annuities became a generally accepted financial instrument in the later middle ages. But still, taking high interest rates, even by means of selling annuities, was considered usurious, and authorities sometimes applied price ceilings participants in financial markets were not to exceed. Particularly emperor Charles V (r. 1515-1555) was quite active in this respect, setting the maximum interest rate at 12 % per year in 1540.17 These maximum interest rates had little effect in practice though, because they were set well above the premiums that were usually paid in financial markets, about 5 % to 6 % for redeemable annuities (table 1) and c. 10 % for life annuities. Thus, the interest rate ceiling did not interfere with pricing.
TABLE 1
Public debt in Holland in 1514 (annuities, in guilders of 20 stuivers)
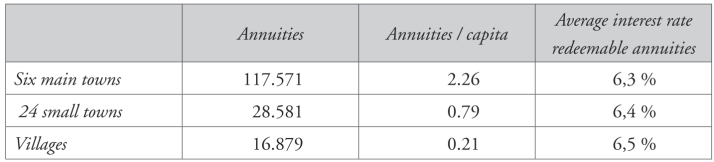
Source: Informacie, author’s calculations.
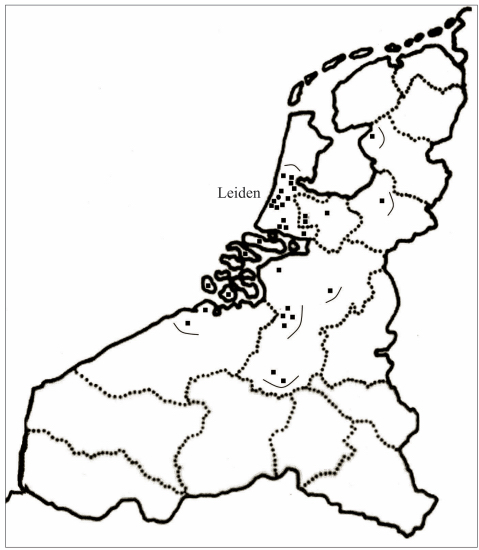
Yet, not all public debt was issued through the market: forced loans were not unheard of in the area under investigation here, the Northern Low Countries, where cash-strapped towns occasionally forced wealthy subjects to buy annuities. But based on our sources, it seems that towns only did so in emergency situations.18 Moreover, a glance at map 2 makes clear that public bodies also sold annuities to foreigners, who could not be forced to buy in any way. It therefore seems that the market was the most important instrument used to create public debt.
So, by the later Middle Ages, in the Low Countries there were only few obstructions to the redistribution of savings through the market. How did towns find savers and negotiate interest rates? To cut costs and reduce risks, they usually preferred to sell annuities to inhabitants and people living nearby.19 Only when their demand for savings exceeded local supply, they turned to large towns in their surroundings and abroad, using brokers to investigate possibilities to sell annuities. Thus, in 1413 the town government of Leiden met with a broker, who apparently advised them to enter capital markets in Brabant. Next, the town sent representatives to Antwerp to sell annuities.20 How they proceeded in Antwerp is unknown, but again it seems likely that they made use of the services of local brokers.21 Representatives of towns usually entered financial markets with a mandate to sell annuities at a certain interest rate, which was probably based on earlier communications with brokers. When they did not manage to sell sufficient annuities at this interest rate they simply could improve their offer. When the government of Leiden found out, in 1472, that demand for life annuities at interest rates of 10 % (one life) and 8,5 % (two lives) was low, it reacted by offering inhabitants of Leiden resp. 11,1 % and 9,1 %.22 In other instances we also encounter price making: some elderly people looking to buy life annuities from Leiden managed to negotiate higher interest rates –presumably to compensate for their low life expectancy–.23 A claim by the large village of Noordwijk also hints at the adjustment of interest rates to sell annuities: the village claimed to have offered interest rates as high as 16,7 %, 20 % and even 25 %, but did not manage to find buyers, presumably because of a lack of creditworthiness.24 Further evidence of price making is presented in figure 2, which will be discussed in more detail later in the text. Towns and villages sold redeemable annuities at interest rates ranging from 4,8 % to 12,5 %, although by far the most were sold in the range of 5,6 % to 6,7 %.25 This range of interest rates also confirms that sovereigns did not yet impose maximum interest rates at levels that interfered with market prices: there was ample room to negotiate interest rates acceptable to creditors and debtors.
The interest rates presented here are nominal interest rates. They are likely to reflect the risk of inflation and currency manipulation. Apart from this interest rates consist of a) compensation for the time the creditor cannot use the money, b) a premium that reflects the expected increase of overall expected income, and c) a default risk premium.26 Considering that Holland was in a monetary union with the regions of Flanders, Brabant and Zeeland in this period, the risk of inflation was more or less the same everywhere in large parts of the Low Countries. In theory the default risk premium may have varied from one public body to another: as explained earlier, towns that had earlier defaulted on annuity payments and therefore lacked creditworthiness, had to offer higher interest rates to investors. Their «credit rating» is thus likely to have affected pricing, although it must be added that towns that had reneged usually did not succeed in selling any more annuities, or stopped borrowing altogether.27
Another element that determined default risk was the institutional framework of financial markets. How much expenses could a creditors expect to make when trying to enforce interest payments from reneging towns? Towns usually secured annuities relying on a community responsibility system that allowed creditors to hold all inhabitants liable for defaults.28 In theory this may have meant that lending to large towns was less risky than to small towns and villages: the community responsibility system depended on the number of liable subjects frequenting the creditor’s residence. For the latter, the chances of encountering an inhabitant liable for public debt was greater in the event they had invested in the public debt of a large town with a substantial group of itinerant merchants. In practice creditors will therefore have selected debtors based on the probability that they would be able to hold someone liable –hence the relatively limited geographical scope of village debt and the much larger scope of urban debt, an issue that will be discussed further on–.
III
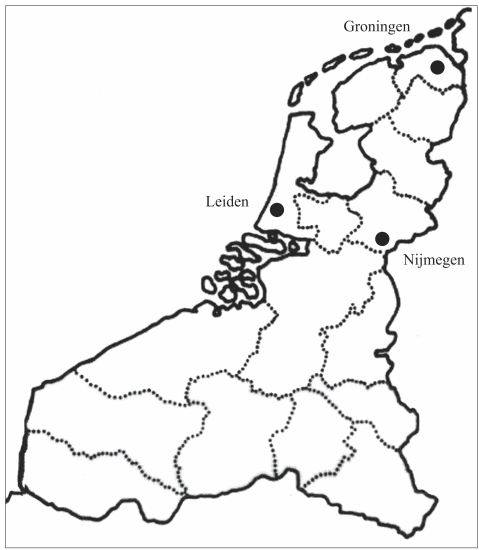
Our first exercise concerns the spatial distribution of investors in urban public debt. Our sample is based on three towns for which an elaborate administration of public debt has been preserved –including the residences of creditors–. The latter information is scarce: towns generally kept a good administration of their public debt, but many usually sufficed with listing the names of their creditors, and the interest they were due. Town accounts of Leiden, Groningen and Nijmegen do provide such information though (map 1).
Leiden was one of the main towns of the county of Holland. It was well known for its textile production, and had a population of c. 10.000-15.000.29 Leiden stands out as one of the few towns that allows us to investigate the spatial distribution of public debt over a longer period of time. Although the town’s accounts go back to 1390, the first to offer an overview of the residences of creditors is from 1434. By that time the town government had apparently realized that a more thorough recording of public debt was necessary to prevent any errors in annuity payments, which were easily made considering the number of annuities Leiden owed.30 Apart from the account of 1434, we have sampled accounts from 1449, 1500 and 1548.31
Figure 1 gives the spatial distribution of the town’s public debt. The figure shows that Leiden initially paid out the greatest part of annuities to its inhabitants: in 1434 these were worth no less than 8.541 guilders out of a total of 10.059 guilders (85 %). However, this figure dropped over time, to 54 % in 1449, and 31 % in 1500, when Leiden had come to rely more on funding coming from out of town. By 1548 the proportion of creditors from Leiden had increased again to almost 50 %.
FIGURE 1
Geographic dispersion of creditors of Leiden (15th-16th centuries)
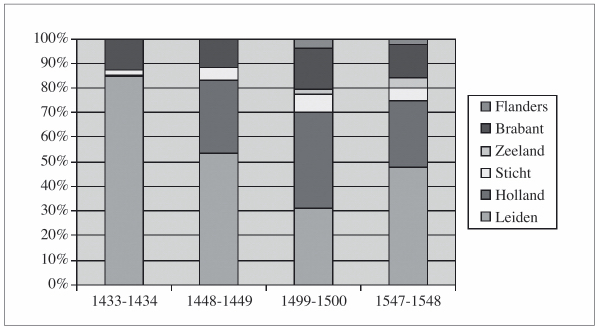
Source: J. Zuijderduijn: Medieval capital markets, p. 178.
Several things are worth discussing in depth. Initially the majority of foreign funding came from the Duchy of Brabant, to the Southeast of Holland. In 1434 the value of annuities Leiden was due in Brabant was 1207 guilders (12 %), and this share more or less stayed the same over time, peaking at 18 % in 1500. Foreign funding coming from Brabant is in line with the the prominence of financial markets in the Southern Low Countries. A wealthy area, in Brabant supply of savings was probably much higher than in Holland, and it seems that Leiden had little trouble selling annuities over there. The almost complete absence of creditors from equally wealthy Flanders is a bit puzzling though.
A second thing that stands out is the increasing importance of financial markets outside Leiden, but within the county of Holland. The value of annuities Leiden was due elsewhere in Holland rose from an almost negligable 33 guilders in 1434 to 2528 guilders in 1449. The town entering financial markets elsewhere in Holland went hand in hand with a gradual diversification: in 1449 creditors from Holland lived in main towns Dordrecht, Haarlem, Delft, Amsterdam and Gouda, in The Hague, and also in Noordwijk, a rather large village to the Northwest of Leiden. In 1500 creditors were also to be found in Rotterdam and a number of small towns and villages (map 2). Finally in 1548 the spatial dispersion had again declined, probably due to the fact that Leiden sold fewer annuities in the sixteenth century, due to severe financial problems that resulted in a low credit rating,32 and also because of the emergence of provincial debt after 1515, causing the representative council (Staten van Holland) to start selling annuities on behalf of the towns of Holland.33
MAP 1
Map of the late-medieval Low Countries
Initially Leiden did not sell many annuities in other provinces of the Northern Low Countries: in 1434 and 1449 the town only owed annuities in the town of Utrecht, in the Nedersticht, located to the East of Holland. Utrecht was the largest town in the Northern Low Countries at the time. In 1500 Leiden had also entered financial markets elsewhere in the Northern Low Countries, having sold annuities in smaller towns and villages in Nedersticht and Oversticht (to the Northeast of Holland). Also, the town owed annuities in Zeeland, to the South. Alltogether the accounts of Leiden suggests that spatial dispersion of public debt increased in the later middle ages: initially most annuities were owed in Leiden, and some in Brabant. Later the share of inhabitants of Leiden decreased, giving way to funding coming from Holland, and eventually also other provinces of the Northern Low Countries. Leiden’s public debt was particularly diversified in 1500 when creditors lived in many towns and villages in Holland and other parts of the Northern Low Countries (see map 2); evidence from other towns in Holland, Haarlem and Gouda, indicates a similarly large spatial dispersion of investors in public debt around 1500.34
MAP 2
Geographic dispersion of foreign public debt of Leiden (1500)
To get an impression of the integration of capital markets elsewhere in the Northern Low Countries, we have gathered some evidence from two towns, Groningen, in the Northeast, and Nijmegen in the East (map 1). Groningen had about 12.500 inhabitants in the mid-sixteenth-century. Even though its public debt was quite modest compared to that of Leiden, yet it was geographically diversified. In the city accounts the magistrates distinguished annuities they had to pay out in the province of Groningen and outside. For instance, in the account of 1535-1536 the magistrate paid 36 annuities within Groningen and 34 outside. Foreign creditors came from places like Kampen, Hamburg and Cologne and the same goes by and large for the account of 1548 (42 inside and 37 outside). Also, in both years annuities paid outside Groningen were much more valuable than those paid inside.35
The public debt of Nijmegen, a town of 10.000-12.000 inhabitants in the mid-sixteenth-century, was less spatially diversified: in 1543 the town paid 60 annuities to inhabitants and 16 to foreigners. Once again, foreign annuities were much more valuable than domestic annuities. Creditors lived in Kampen, Cologne, Duisburg and Venlo among others. These two examples indicate that the credit networks of Nijmegen and Groningen may have been less elaborate than those of towns in Holland. Yet, these towns did rely on foreign capital markets, particularly those in the Northwest and West of the German Empire.
IV
The development of the public debt of Leiden, Groningen and Nijmegen suggests that financial markets helped to redistribute money, from savers looking for investment opportunities, to towns looking for foreign funding. They did this on a local, regional, and interregional level. This finding begs the question to what degree late-medieval financial markets contributed to a more or less efficient reallocation of savings. Although difficult to answer, the question of efficiency is crucial for understanding markets, since these are supposed to bring together supply in demand in such a way that prices converge, and «pockets» where prices are either relatively high or low disappear. To get an impression of «efficiency» we will use a dataset based on a large government survey taken in Holland in 1514, inquiring amongst other things into the public debt towns and villages had created.
In 151436 Maximilian I (regent 1482-1494, 1506-1515) ordered government agents to investigate into the wealth of towns and villages, in order to come up with a new distribution code for taxation. In Holland the provincial government was not entitled to tax its subjects individually. Instead, the central government ordered each community to pay its share, based on a distribution code, and next local governments taxed its citizens or villagers.37 The government agents talked to representatives of towns and villages and questioned them about the number of inhabitants, the economic situation and the way they usually levied taxes. They also asked about the financial situation, about revenues and expenses, and loans local governments had contracted: which type of loans, under what conditions these had been contracted, when and why.
The investigation has been preserved in a document called Informacie. Since Robert Fruin edited this source in 1866 many historians have used it in research into late-medieval Holland. Some questioned its credibility, pointing out that town and village representatives probably tried to make things look worse than they were in order to get a lower taxation, while others deemed the source to be reliable enough.38 It is certainly so that some representatives of towns and villages overacted, complaining about the horrors of war and natural disaster. And even though they were questioned under oath, some representatives even made false statements. However, fraud seems to have been restricted to statements about the landed property of the villagers.39 This is hardly surprising because landed property was one of the main elements, if not the main element, the distribution code would be based on. The data regarding public debt probably had a much smaller effect on the new distribution code.
The reliability of the data on public debt the Informacie gives can be confirmed by referring to town accounts, such as those of Dordrecht. The interest rates mentioned in both Informacie and town accounts are identical, which means that the survey provides insight in sale conditions, and does not reflect any changes made to contracts afterward.40 Furthermore, it has become clear that government agents, during their investigation in 1514, also required representatives of towns to back up their statements with evidence in writing. Even though some town magistrates sometimes showed little enthusiasm to hand over documents such as town accounts, they usually cooperated. It was more difficult to get village governments to present evidence in writing because few villages seem to have kept financial records. Only in one case we have been able to compare the data the Informacie gives with village accounts. The representatives of the large village of Noordwijk claimed they paid an interest of 31½ guilders, and the village accounts support their statement.41
What does the Informacie reveal about public debt? By 1514 all towns of Holland had created public debt, having sold life and redeemable annuities. Moreover, 60 % of the villages of Holland had done so as well. This public debt was mainly created during the period 1477-1514, during a period of increasing financial pressure due to ongoing state formation and war efforts by the Dukes of Burgundy –in particular Charles the Bold (r. 1467-1477) and Maximilian I. Faced with ambitious rulers, towns and villages used most of the principals to be able to pay taxes and war expenses. In contrast, only a small part of the funds went to such causes as public works.42
Table 1 gives an overview of the annuities towns and villages had to pay out every year. The main towns of Holland were most heavily indebted: the burden of annuities per capita was 2,26 guilders. In other words: here every inhabitant contributed 2,26 guilders –presumably via taxation– to interest payments. In Holland’s many smaller towns the per capita contribution was much lower, at 0,79 guilders. This difference is most likely the result of the main towns increasingly being used by the rulers to gain access to financial markets: the towns thus sold annuities on behalf of the rulers because the latter lacked creditworthiness. The rulers did not use smaller towns to such ends, let alone villages: the latter’s public debt was on average 0,21 guilders per capita.
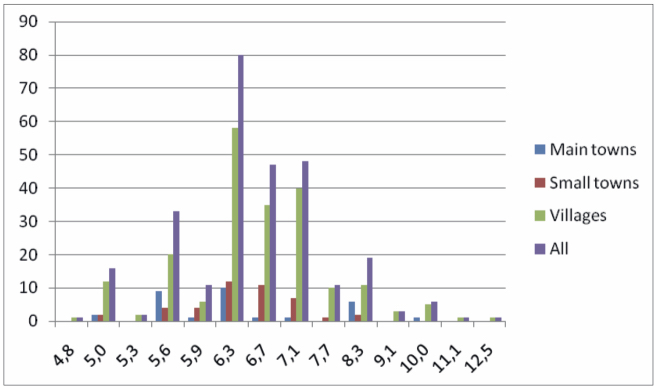
The Informacie provides detailed information of the interest rates towns and villages paid on annuities –i. e. of the prices they paid in financial markets–. We have decided to focus on redeemable annuities, and to disregard life annuities: pricing of life annuities is likely to have been based in part on the age of the beneficiary and hence the number of years he could be expected to live. Since data on ages is not given in the Informacie, interest rates on life annuities cannot be used as an indicator for pricing. However, our source does give 282 interest rates public bodies paid on redeemable annuities. Most redeemable annuities (219 out of 279) carried an interest rate between 5,6 % and 7,1 %. A rate of 6,25 % was most common (80 of 279 observations).
Based on the data presented in table 1 and figure 2 it seems that towns had better access to financial markets than villages. First of all, the main towns paid on average 6,3 %, the small towns 6,4 %, and the villages 6,5 %. Second, towns rarely paid more than 7,1 %: as we have seen in section III, this may be due to the towns’capacity to participate in various financial markets, in Holland and abroad, and thus being able to pick out markets where prices were low. The highest interest rate paid by a town was 8,3 % by Dordrecht, on annuities sold between 1472 and 1490.43 It is difficult to explain why this town would have paid higher interest rates than the other large towns, but it may have had something to do with the deterioration of Dordrecht’s financial situation after the 1460’s.44 Under such circumstances Dordrecht would have had increasing problems selling annuities at favorable interest rates.
FIGURE 2
Premiums on redeemable annuities (1514; N=279)
Main towns: Dordecht, Haarlem, Delft, Leiden, Gouda, Amsterdam. Small towns: Beverwijk, Alkmaar, Hoorn, Enkhuizen, Medemblik, Edam, Monnikendam, Naarden, Weesp and Weesperkerspel, Muiden, Purmerend, Woerden, Oudewater, The Hague, Vlaardingen Gravenzande, Schoonhoven, Gorinchem, Heusden, Rotterdam, Schiedam, Geertruidenberg, Asperen, Heukelum.
Towns rarely paid interest rates below 5,6 %. The outliers in our dataset –annuities carrying premiums either below 5,6 % or above 7,1 %–, had generally been sold by villages (46 of 60). This difference may well be due to towns selling annuities in large financial centers, where they competed with others in attracting investors, and where investors likewise competed amongst each other, the result being price convergence. Apparently villages generally operated on a smaller scale: they did not explore several financial markets, but would usually have tried to sell an annuity to a fellow villager, or to an inhabitant of the nearest village or town. They operated in a limited number of localities, which could also be fairly isolated: this sometimes yielded them favourable premiums, but could also force them to accept high interest rates.
To be sure: not all villages found buyers for their annuities: several complained they lacked credit during the interrogation in 1514. Thus, when Hilversum, to the Southeast of Amsterdam, did not manage to increase its public debt, the villagers were forced to increase their private debt. In their own words:
Say that they, for a lack of credit, were unable to sell any more annuities as a village community, forcing the villagers to sell 100 guilders worth of annuities, which they mortgaged on their houses and land.45
It turned out that creating public debt, using as a security a community responsibility system to make all inhabitants liable for annuity payments, was impossible for Hilversum. A solution was found in having well-off villagers selling annuities on collateral of their privately owned land. This example makes clear that access to financial markets was not at all evident for villages; it also underscores the pricing mechanisms that ultimately priced Hilversum –and quite a few other villages– out of the market.46
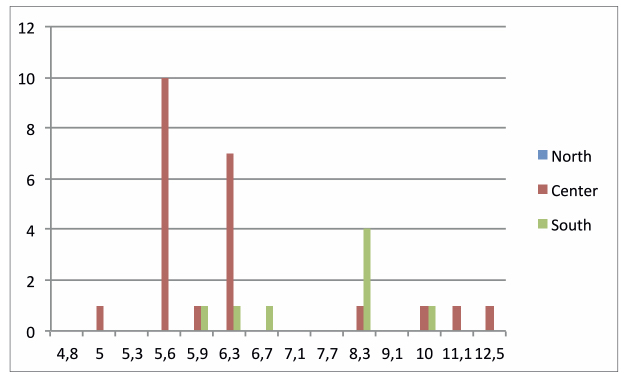
For our understanding of the functioning of financial markets, it would be interesting to know to what degree regional differences existed. When we take a closer look at the premiums paid by towns (figure 3), we see that differences were relatively low in the North and centre of Holland. In the only large town of the South, Dordrecht, premiums show greater diversity, varying from 6,7 % to 8,3 %. Dordrecht’s average interest rate was relatively high at 7,1 %, whereas averages in the North (6,7 %) and centre (6,1 %) were lower.
FIGURE 3
Interest rates on redeemable annuities main towns (1514)
North: area above river IJ, no large towns. Center: area between river oude Maas/ Merwede and river IJ, large towns Haarlem, Delft, Leiden, Gouda, Amsterdam. South: area below river oude Maas/ Merwede, large town Dordrecht.